多读书多实践,勤思考善领悟

JavaFX Stacked Area Chart(堆积面积图)

本文于1662天之前发表,文中内容可能已经过时。

StackedArea Chart是Area Chart的变体,显示每个值的贡献趋势(例如 - 加班)。堆叠区域使每个系列相邻,但不与前面的系列重叠。这与区域图表形成对比,其中每个系列覆盖前面的系列。
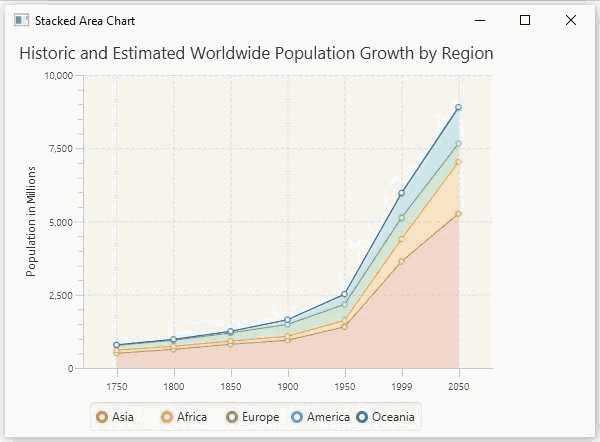
以下是描绘人口增长的堆积图表。

堆积面积

在JavaFX中,堆积区域图表由名为StackedAreaChart的类表示。该类属于包javafx.scene.chart。通过实例化此类,您可以在JavaFX中创建StackedAreaChart节点。

生成堆积面积图的步骤

要在JavaFX中生成堆积区域图表,请按照以下步骤操作。

第1步:创建一个类

创建Java类并继承包javafx.applicationApplication类。然后,您可以按如下方式实现此类的start()方法。

1
2
3
4
5
public class ClassName extends Application { 
@Override
public void start(Stage primaryStage) throws Exception {
}
}

第2步:定义轴

定义堆积面积图的X和Y轴并为其设置标签。在我们的例子中,X轴表示从1750年到2050年的不同年份。这些年有50年的主要蜱单位。而Y轴代表数百万人口的增长。

1
2
3
4
5
6
7
8
9
//Defining the X axis               
CategoryAxis xAxis = new CategoryAxis();

xAxis.setCategories(FXCollections.<String>observableArrayList
(Arrays.asList("1 750", "1800", "1850", "1900", "1950", "1999", "2050" )));

//Defining the Y axis
NumberAxis yAxis = new NumberAxis(0, 10000, 2500);
yAxis.setLabel("Population in Billions");

第3步:创建堆积面积图

通过实例化包javafx.scene.chart的名为StackedAreaChart的类来创建折线图。对于此类的构造函数,传递表示在上一步中创建的X轴和Y轴的对象。

1
2
3
//Creating the Area chart 
StackedAreaChart<String, Number> areaChart = new StackedAreaChart(xAxis, yAxis);
areaChart.setTitle("Historic and Estimated Worldwide Population Growth by Region");

第4步:准备数据

实例化XYChart.Series类并将数据(一系列,x和y坐标)添加到此类的Observable列表中,如下所示 -

1
2
3
4
5
6
7
8
9
10
11
12
13
14
15
16
17
18
19
20
21
22
23
24
25
26
27
28
29
30
31
32
33
34
35
36
37
38
39
40
41
42
43
44
45
46
47
48
49
50
51
//Prepare XYChart.Series objects by setting data 
XYChart.Series series1 = new XYChart.Series();
series1.setName("Asia");
series1.getData().add(new XYChart.Data("1750", 502));
series1.getData().add(new XYChart.Data("1800", 635));
series1.getData().add(new XYChart.Data("1850", 809));
series1.getData().add(new XYChart.Data("1900", 947));
series1.getData().add(new XYChart.Data("1950", 1402));
series1.getData().add(new XYChart.Data("1999", 3634));
series1.getData().add(new XYChart.Data("2050", 5268));

XYChart.Series series2 = new XYChart.Series();
series2.setName("Africa");
series2.getData().add(new XYChart.Data("1750", 106));
series2.getData().add(new XYChart.Data("1800", 107));
series2.getData().add(new XYChart.Data("1850", 111));
series2.getData().add(new XYChart.Data("1900", 133));
series2.getData().add(new XYChart.Data("1950", 221));
series2.getData().add(new XYChart.Data("1999", 767));
series2.getData().add(new XYChart.Data("2050", 1766));

XYChart.Series series3 = new XYChart.Series();
series3.setName("Europe");
series3.getData().add(new XYChart.Data("1750", 163));
series3.getData().add(new XYChart.Data("1800", 203));
series3.getData().add(new XYChart.Data("1850", 276));
series3.getData().add(new XYChart.Data("1900", 408));
series3.getData().add(new XYChart.Data("1950", 547));
series3.getData().add(new XYChart.Data("1999", 729));
series3.getData().add(new XYChart.Data("2050", 628));

XYChart.Series series4 = new XYChart.Series();
series4.setName("America");
series4.getData().add(new XYChart.Data("1750", 18));
series4.getData().add(new XYChart.Data("1800", 31));

series4.getData().add(new XYChart.Data("1850", 54));
series4.getData().add(new XYChart.Data("1900", 156));
series4.getData().add(new XYChart.Data("1950", 339));
series4.getData().add(new XYChart.Data("1999", 818));
series4.getData().add(new XYChart.Data("2050", 1201));

XYChart.Series series5 = new XYChart.Series();
series5.setName("Oceania");
series5.getData().add(new XYChart.Data("1750", 2));
series5.getData().add(new XYChart.Data("1800", 2));
series5.getData().add(new XYChart.Data("1850", 2));
series5.getData().add(new XYChart.Data("1900", 6));
series5.getData().add(new XYChart.Data("1950", 13));
series5.getData().add(new XYChart.Data("1999", 30));
series5.getData().add(new XYChart.Data("2050", 46));

第5步:将数据添加到堆积区域图表

将上一步骤中准备的数据系列添加到堆积区域图表中,如下所示 -

1
2
//Setting the data to area chart        
areaChart.getData().addAll(series1, series2, series3, series4, series5);

第6步:创建组对象

start()方法中,通过实例化名Group的类来创建组对象,该类属于包javafx.scene

将上一步中创建的StackedAreaChart(节点)对象作为参数传递给Group类的构造函数。这样做是为了将其添加到组中,如下所示 -

1
Group root = new Group(stackedAreaChart);

第7步:创建场景对象

通过实例化名Scene的类来创建一个Scene,该类属于包javafx.scene。在此类中,传递上一步中创建的Group对象(root)。

除了根对象之外,您还可以传递两个表示屏幕高度和宽度的双参数,以及Group类的对象,如下所示。

1
Scene scene = new Scene(group ,600, 300);

第8步:设置舞台的标题

您可以使用Stage类的setTitle()方法将标题设置为舞台。所述primaryStage是Stage对象,它被传递给场景类作为参数的启动方法。

使用primaryStage对象,将场景标题设置为Sample Application,如下所示。

1
primaryStage.setTitle("Sample Application");

第9步:将场景添加到舞台

您可以使用名为Stage的类的方法setScene()将Scene对象添加到舞台。使用此方法添加前面步骤中准备的Scene对象,如下所示。

1
primaryStage.setScene(scene);

第10步:显示舞台的内容

显示场景的使用命名的方法的内容显示()的的阶段类,如下所示。

1
primaryStage.show();

第11步:启动应用程序

通过从main方法调用Application类的静态方法launch()来启动JavaFX应用程序,如下所示。

1
2
3
public static void main(String args[]){   
launch(args);
}

下表列出了从1750年到2050年不同大陆的人口。

亚洲 非洲 欧洲 美国 大洋洲
1750 502 106 163 18 2
1800 635 107 203 31 2
1850 809 111 276 54 2
1900 947 133 408 156 6
1950年 1402 221 547 339 13
1999年 3634 767 729 818 30
2050 5268 1766 628 1201 46

以下是一个Java程序,它使用JavaFX生成描述上述数据的堆积区域图。

将此代码保存在名为StackedAreaChartExample.java的文件中。

1
2
3
4
5
6
7
8
9
10
11
12
13
14
15
16
17
18
19
20
21
22
23
24
25
26
27
28
29
30
31
32
33
34
35
36
37
38
39
40
41
42
43
44
45
46
47
48
49
50
51
52
53
54
55
56
57
58
59
60
61
62
63
64
65
66
67
68
69
70
71
72
73
74
75
76
77
78
79
80
81
82
83
84
85
86
87
88
89
90
91
92
93
94
95
96
97
98
99
100
101
102
import java.util.Arrays; 
import javafx.application.Application;
import static javafx.application.Application.launch;
import javafx.collections.FXCollections;
import javafx.scene.Group;
import javafx.scene.Scene;
import javafx.scene.chart.CategoryAxis;
import javafx.stage.Stage;
import javafx.scene.chart.NumberAxis;
import javafx.scene.chart.StackedAreaChart;
import javafx.scene.chart.XYChart;

public class StackedAreaChartExample extends Application {
@Override
public void start(Stage stage) {
//Defining the axes
CategoryAxis xAxis = new CategoryAxis();
xAxis.setCategories(FXCollections.<String>observableArrayList(
Arrays.asList("1750", "1800", "1850", "1900", "1950", "1999", "2050" )));

NumberAxis yAxis = new NumberAxis(0, 10000, 2500);
yAxis.setLabel("Population in Millions");

//Creating the Area chart
StackedAreaChart<String, Number> areaChart = new StackedAreaChart(xAxis, yAxis);
areaChart.setTitle("Historic and Estimated Worldwide Population Growth by Region");

//Prepare XYChart.Series objects by setting data
XYChart.Series series1 = new XYChart.Series();

series1.setName("Asia");
series1.getData().add(new XYChart.Data("1750", 502));
series1.getData().add(new XYChart.Data("1800", 635));
series1.getData().add(new XYChart.Data("1850", 809));
series1.getData().add(new XYChart.Data("1900", 947));
series1.getData().add(new XYChart.Data("1950", 1402));
series1.getData().add(new XYChart.Data("1999", 3634));
series1.getData().add(new XYChart.Data("2050", 5268));

XYChart.Series series2 = new XYChart.Series();
series2.setName("Africa");
series2.getData().add(new XYChart.Data("1750", 106));
series2.getData().add(new XYChart.Data("1800", 107));
series2.getData().add(new XYChart.Data("1850", 111));
series2.getData().add(new XYChart.Data("1900", 133));
series2.getData().add(new XYChart.Data("1950", 221));
series2.getData().add(new XYChart.Data("1999", 767));
series2.getData().add(new XYChart.Data("2050", 1766));

XYChart.Series series3 = new XYChart.Series();
series3.setName("Europe");

series3.getData().add(new XYChart.Data("1750", 163));
series3.getData().add(new XYChart.Data("1800", 203));
series3.getData().add(new XYChart.Data("1850", 276));
series3.getData().add(new XYChart.Data("1900", 408));
series3.getData().add(new XYChart.Data("1950", 547));
series3.getData().add(new XYChart.Data("1999", 729));
series3.getData().add(new XYChart.Data("2050", 628));

XYChart.Series series4 = new XYChart.Series();
series4.setName("America");
series4.getData().add(new XYChart.Data("1750", 18));
series4.getData().add(new XYChart.Data("1800", 31));
series4.getData().add(new XYChart.Data("1850", 54));
series4.getData().add(new XYChart.Data("1900", 156));
series4.getData().add(new XYChart.Data("1950", 339));
series4.getData().add(new XYChart.Data("1999", 818));
series4.getData().add(new XYChart.Data("2050", 1201));

XYChart.Series series5 = new XYChart.Series();
series5.setName("Oceania");
series5.getData().add(new XYChart.Data("1750", 2));
series5.getData().add(new XYChart.Data("1800", 2));
series5.getData().add(new XYChart.Data("1850", 2));
series5.getData().add(new XYChart.Data("1900", 6));
series5.getData().add(new XYChart.Data("1950", 13));
series5.getData().add(new XYChart.Data("1999", 30));
series5.getData().add(new XYChart.Data("2050", 46));

//Setting the data to area chart
areaChart.getData().addAll(series1, series2, series3, series4, series5);

//Creating a Group object
Group root = new Group(areaChart);

//Creating a scene object
Scene scene = new Scene(root, 600, 400);

//Setting title to the Stage
stage.setTitle("Stacked Area Chart");

//Adding scene to the stage
stage.setScene(scene);

//Displaying the contents of the stage
stage.show();
}
public static void main(String args[]){
launch(args);
}
}

使用以下命令从命令提示符编译并执行保存的java文件。

1
2
javac StackedAreaChartExample.java 
java StackedAreaChartExample

在执行时,上述程序生成一个显示堆积区域图的JavaFX窗口,如下所示。

堆积区域示例