## Logging configuration:
 ## Run telegraf with debug log messages.
 debug = false
 ## Run telegraf in quiet mode (error log messages only).
 quiet = false
 ## Specify the log file name. The empty string means to log to stderr.
 logfile = "C:/my/telegraf/log/telegraf.log"
[meta]
  # Where the metadata/raft database is stored
  # dir = "/var/lib/influxdb/meta"
  dir = "D:/tick/influxdb-1.7.7-1/meta"

[data]
  # The directory where the TSM storage engine stores TSM files.
  # dir = "/var/lib/influxdb/data"
  dir = "D:/tick/influxdb-1.7.7-1/data"

  # The directory where the TSM storage engine stores WAL files.
  #wal-dir = "/var/lib/influxdb/wal"
  wal-dir = "D:/tick/influxdb-1.7.7-1/wal"

[logging]
  # Determines which log encoder to use for logs. Available options
  # are auto, logfmt, and json. auto will use a more a more user-friendly
  # output format if the output terminal is a TTY, but the format is not as
  # easily machine-readable. When the output is a non-TTY, auto will use
  # logfmt.
  # format = "auto"
  format = "auto"

  # Determines which level of logs will be emitted. The available levels
  # are error, warn, info, and debug. Logs that are equal to or above the
  # specified level will be emitted.
  # level = "info"
  level = "info"
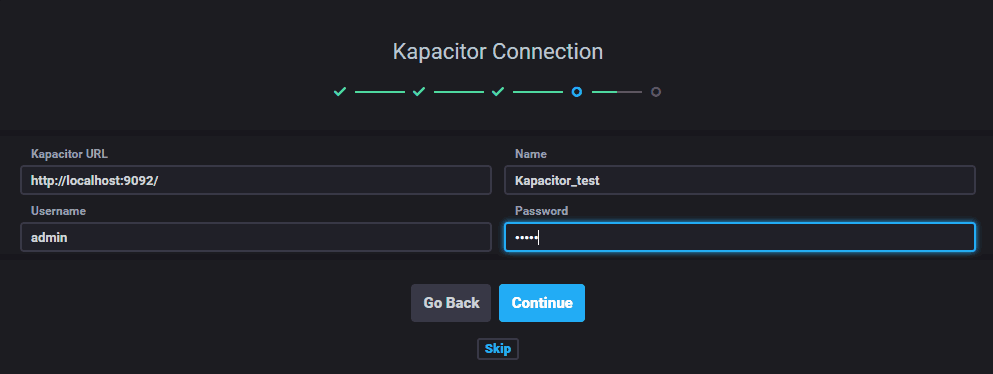
[logging] # Destination for logs # Can be a path to a file or 'STDOUT', 'STDERR'. # file = "/var/log/kapacitor/kapacitor.log" file = "D:/tick/kapacitor-1.5.3-1/kapacitor.log"
# Logging level can be one of: # DEBUG, INFO, ERROR # HTTP logging can be disabled in the [http] config section. level = "INFO"
[load] # Enable/Disable the service for loading tasks/templates/handlers # from a directory enabled = true # Directory where task/template/handler files are set # dir = "/etc/kapacitor/load" dir = "D:/tick/kapacitor-1.5.3-1/load"
[replay] # Where to store replay files, aka recordings. # dir = "/var/lib/kapacitor/replay" dir = "D:/tick/kapacitor-1.5.3-1/replay"
[task] # Where to store the tasks database # DEPRECATED: This option is not needed for new installations. # It is only used to determine the location of the task.db file # for migrating to the new `storage` service. # dir = "/var/lib/kapacitor/tasks" dir = "D:/tick/kapacitor-1.5.3-1/tasks"
# How often to snapshot running task state. snapshot-interval = "60s"
[storage] # Where to store the Kapacitor boltdb database # boltdb = "/var/lib/kapacitor/kapacitor.db" boltdb = "D:/tick/kapacitor-1.5.3-1/kapacitor.db"
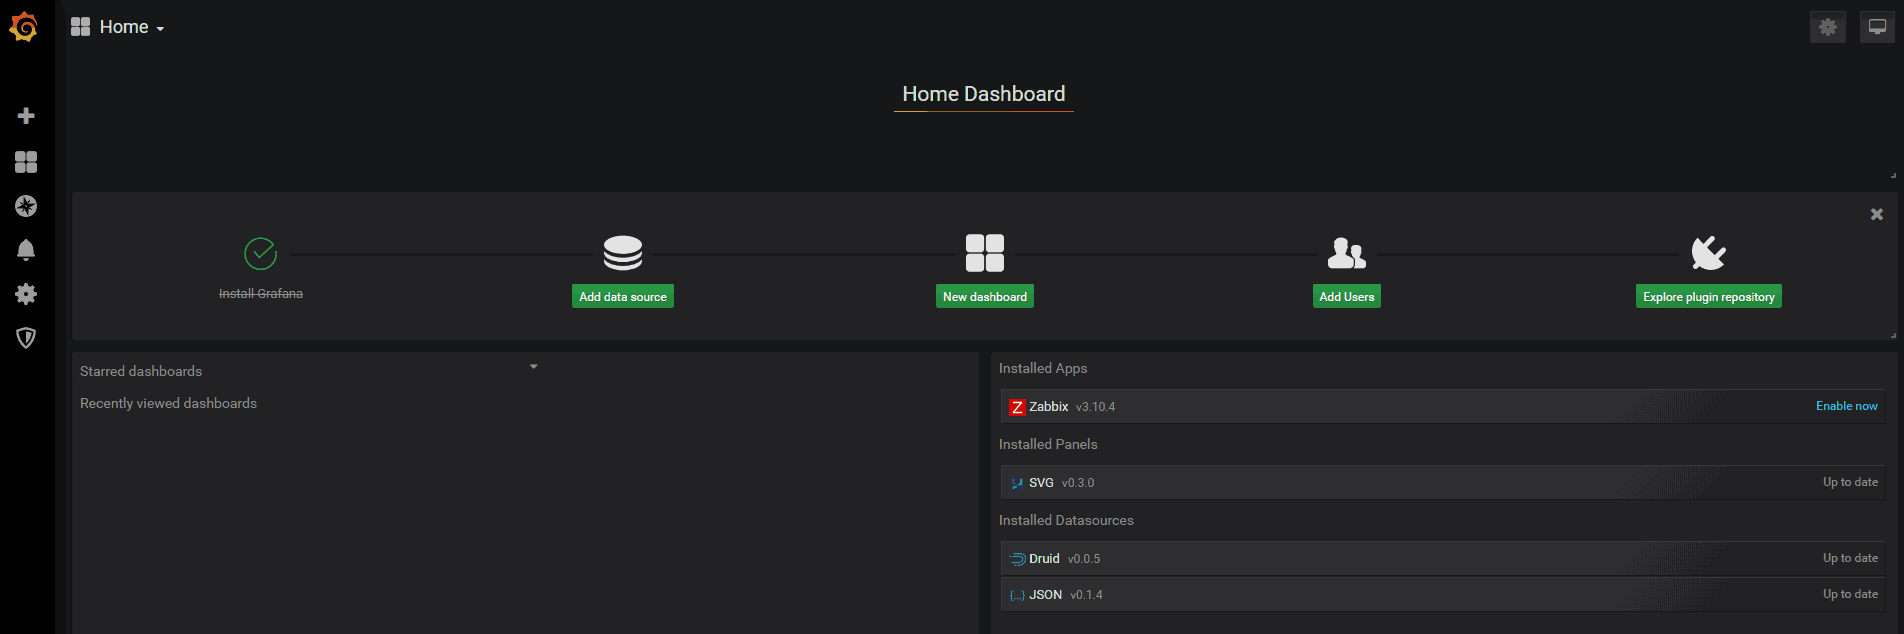
[paths] # Path to where grafana can store temp files, sessions, and the sqlite3 db (if that is used) # ;data = /var/lib/grafana ;data = D:/tick/grafana-6.3.2
# Temporary files in `data` directory older than given duration will be removed ;temp_data_lifetime = 24h
# Directory where grafana can store logs # ;logs = /var/log/grafana ;logs = D:/tick/grafana-6.3.2/log
# Directory where grafana will automatically scan and look for plugins # ;plugins = /var/lib/grafana/plugins ;plugins = D:/tick/grafana-6.3.2/plugins
# folder that contains provisioning config files that grafana will apply on startup and while running. ;provisioning = conf/provisioning