多读书多实践,勤思考善领悟

JavaFX Line Chart(折线图)

本文于1662天之前发表,文中内容可能已经过时。

折线图或折线图将信息显示为由直线段连接的一系列数据点(标记)。折线图显示数据如何以相等的时间频率变化。
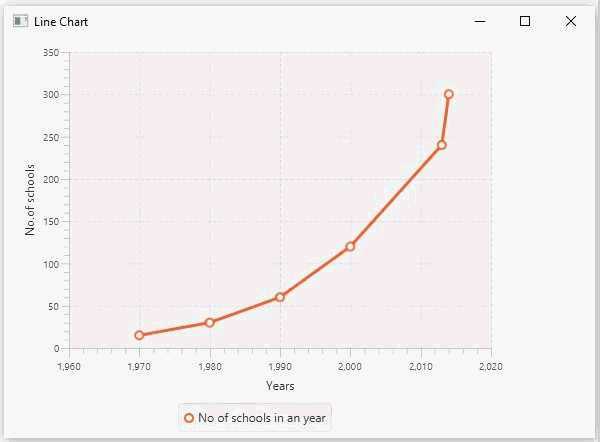
以下是描绘不同年份学校数量的折线图。

折线图

在JavaFX中,折线图由名为LineChart的类表示。该类属于包javafx.scene.chart。通过实例化此类,您可以在JavaFX中创建LineChart节点。

生成折线图的步骤

要在JavaFX中生成折线图,您应该按照下面给出的步骤操作。

第1步:创建一个类

创建Java类并继承包javafx.applicationApplication类。然后,您可以按如下方式实现此类的start()方法。

1
2
3
4
5
public class ClassName extends Application { 
@Override
public void start(Stage primaryStage) throws Exception {
}
}

第2步:定义轴

定义折线图的X和Y轴并为其设置标签。

在我们的例子中,X轴代表从1960年到2020年的年份,每十年有一个主要的刻度线。

1
2
3
4
5
6
7
//Defining X axis  
NumberAxis xAxis = new NumberAxis(1960, 2020, 10);
xAxis.setLabel("Years");

//Defining y axis
NumberAxis yAxis = new NumberAxis(0, 350, 50);
yAxis.setLabel("No.of schools");

第3步:创建折线图

通过实例化包javafx.scene.chart的名为LineChart的类来创建折线图。对于此类的构造函数,传递表示在上一步中创建的X轴和Y轴的对象。

1
LineChart linechart = new LineChart(xAxis, yAxis);

第4步:准备数据

实例化XYChart.Series类。然后将数据(一系列,x和y坐标)添加到此类的Observable列表中,如下所示 -

1
2
3
4
5
6
7
8
9
XYChart.Series series = new XYChart.Series(); 
series.setName("No of schools in an year");

series.getData().add(new XYChart.Data(1970, 15));
series.getData().add(new XYChart.Data(1980, 30));
series.getData().add(new XYChart.Data(1990, 60));
series.getData().add(new XYChart.Data(2000, 120));
series.getData().add(new XYChart.Data(2013, 240));
series.getData().add(new XYChart.Data(2014, 300));

第5步:将数据添加到折线图

将上一步中准备的数据系列添加到折线图中,如下所示 -

1
2
//Setting the data to Line chart    
linechart.getData().add(series);

第6步:创建组对象

start()方法中,通过实例化名为Group的类来创建组对象。这属于包javafx.scene

将在上一步中创建的LineChart(节点)对象作为参数传递给Group类的构造函数。这样做是为了将其添加到组中,如下所示 -

1
Group root = new Group(linechart);

第7步:创建场景对象

通过实例化名Scene的类来创建一个Scene,该类属于包javafx.scene。对于此类,传递在上一步中创建的Group对象(root)。

除了根对象之外,您还可以传递两个表示屏幕高度和宽度的双参数以及Group类的对象,如下所示。

1
Scene scene = new Scene(group ,600, 300);

第8步:设置舞台的标题

您可以使用Stage类的setTitle()方法将标题设置为舞台。所述primaryStage是Stage对象,它被传递给场景类作为参数的启动方法。

使用primaryStage对象,将场景标题设置为Sample Application,如下所示。

1
primaryStage.setTitle("Sample Application");

第9步:将场景添加到舞台

您可以使用名为Stage的类的方法setScene()将Scene对象添加到舞台。使用此方法添加前面步骤中准备的Scene对象,如下所示。

1
primaryStage.setScene(scene);

第10步:显示舞台的内容

显示场景的使用命名的方法的内容显示()的的阶段类,如下所示。

1
primaryStage.show();

第11步:启动应用程序

通过从main方法调用Application类的静态方法launch()来启动JavaFX应用程序,如下所示。

1
2
3
public static void main(String args[]){   
launch(args);
}

下表描述了从1970年到2014年的一个地区的学校数量。

学校数量
1970年 15
1980年 30
1990年 60
2000 120
2013 240
2014 300

以下是一个Java程序,它使用JavaFX生成描绘上述数据的折线图。

将此代码保存在名为LineChartExample.java的文件中。

1
2
3
4
5
6
7
8
9
10
11
12
13
14
15
16
17
18
19
20
21
22
23
24
25
26
27
28
29
30
31
32
33
34
35
36
37
38
39
40
41
42
43
44
45
46
47
48
49
50
51
52
53
54
55
import javafx.application.Application; 
import javafx.scene.Group;
import javafx.scene.Scene;
import javafx.stage.Stage;
import javafx.scene.chart.LineChart;
import javafx.scene.chart.NumberAxis;
import javafx.scene.chart.XYChart;

public class LineChartExample extends Application {
@Override
public void start(Stage stage) {
//Defining the x axis
NumberAxis xAxis = new NumberAxis(1960, 2020, 10);
xAxis.setLabel("Years");

//Defining the y axis
NumberAxis yAxis = new NumberAxis (0, 350, 50);
yAxis.setLabel("No.of schools");

//Creating the line chart
LineChart linechart = new LineChart(xAxis, yAxis);

//Prepare XYChart.Series objects by setting data
XYChart.Series series = new XYChart.Series();
series.setName("No of schools in an year");

series.getData().add(new XYChart.Data(1970, 15));
series.getData().add(new XYChart.Data(1980, 30));
series.getData().add(new XYChart.Data(1990, 60));
series.getData().add(new XYChart.Data(2000, 120));
series.getData().add(new XYChart.Data(2013, 240));
series.getData().add(new XYChart.Data(2014, 300));

//Setting the data to Line chart
linechart.getData().add(series);

//Creating a Group object
Group root = new Group(linechart);

//Creating a scene object
Scene scene = new Scene(root, 600, 400);

//Setting title to the Stage
stage.setTitle("Line Chart");

//Adding scene to the stage
stage.setScene(scene);

//Displaying the contents of the stage
stage.show();
}
public static void main(String args[]){
launch(args);
}
}

使用以下命令从命令提示符编译并执行保存的java文件。

1
2
javac LineChartExample.java 
java LineChartExample

执行时,上述程序生成一个显示折线图的JavaFX窗口,如下所示。

折线图示例